

Find out what drives audience engagement, from the first click to what people do after they leave.
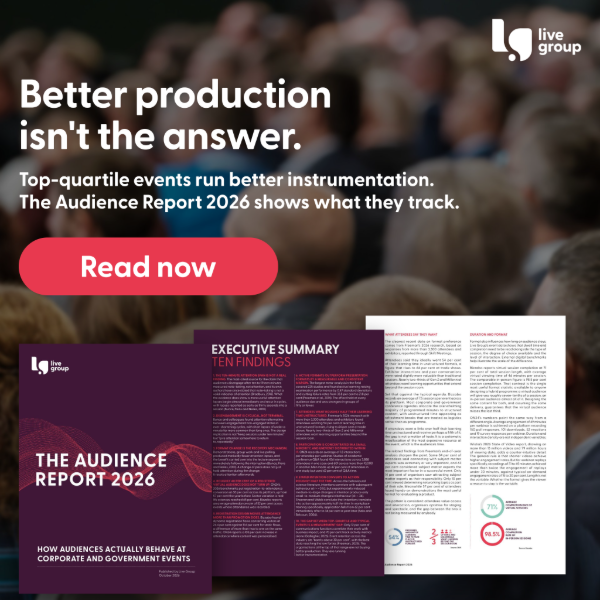
The Audience Report 2026 is a free 34-page guide for anyone who runs corporate or government events. Inside, you’ll get attendance benchmarks by sector, the registration changes that double sign-ups, the session formats that hold attention longest, who really speaks up in Q&A, how event dwell time differs between virtual and in-person audiences, and ten practical actions to engage an audience before, during and after your event.
What’s inside
- When delegates actually disengage. Why the ten-minute attention span is a myth, and the format changes that bring attention back.
- Who turns up. Registration-to-attendance benchmarks by sector, and why registration design moves the number more than promotion.
- Which session formats hold attention longest. A practical format hierarchy, from single-voice keynotes to hands-on demonstrations.
- What delegates ask about. Who takes part in Q&A and polling, who stays silent, and how to hear the whole room.
- The gap between stated intent and action. Why post-event surveys mislead, and how to measure what your event changed.
- The top quartile of events. The four habits that separate the best-performing events from the rest.

Access now.
To access the guide, simply fill in your details below.
Audience engagement is how actively attendees take part in an event, measured through what they do: answering polls, asking questions, joining discussions, staying for sessions and acting on the content afterwards. Attendance alone shows who turned up, not whether they engaged.
The most reliable way to engage an audience is to give people something to do at regular intervals, such as a poll, a short discussion or a demonstration. Research across 225 studies found active formats outperform lecture-style formats at every audience size, and a change of format resets attention for the content that follows.
There is no reliable evidence for a fixed ten-minute attention span. Studies show attention lapses can begin within 30 seconds and come and go in cycles throughout a session, so the aim is to give attention regular reasons to return.
Event dwell time is how long attendees stay in a session, space or virtual stream. Virtual sessions average about 71% completion and in-person sessions about 98.5%, so dwell time should always be compared by format.
Audience demographics affect who participates. In one study of conference Q&A, men were 42% of attendees but took 62% of Q&A time, and typed questions drew a broader mix of people than spoken ones.
For webinars, a registration-to-attendance rate of around 60% is the current average on ON24’s platform. The best benchmark is your own history for the same audience and format.
Yes. The full 34-page report is free to download from this page.